- Articles ›
- Operations and IT ›
- Gantt Chart - Scheduling Operations Articles
Gantt Chart - Scheduling Operations
Operations form an indispensable part of management. Companies have to ensure that all the projects which they undertake have to be completed systematically and according to the required priorities. It is utmost important that companies plan their production, while helps them produce goods effectively & efficiently, without loss of time, saving on inventory stocks etc. One of the most imperative and prominent ways which helps organizations and business professionals schedule and plan their work is by using the Gantt Chart.

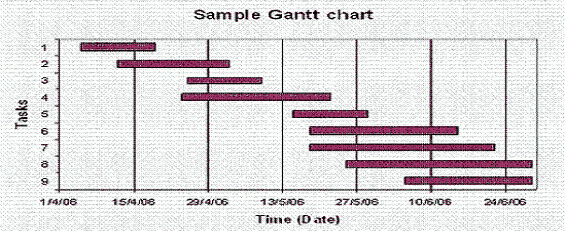
Gantt chart is a mechanism and illustration by using bar charts which helps people to create a project schedule. Gantt chart illustrations show a time table where the elements of a project are broken down into simpler modules and each task is given a specific time frame in which it is expected to complete. This break down helps in understanding the approximate time to complete each task and helps companies and individuals prioritize their work, increases efficiency and saves costs by avoiding delays. It also considers a buffer time period which gives each task an additional time in which it must be completed, just in case in hasn’t been finished.
Gantt chart techniques helps in organizing activities and tasks effectively and efficiently. Gantt chart break down helps in allocating resources like employees for a particular task, amount of money to be spent at each stage etc. Gantt Chart illustrations give representation regarding three parameters i.e. time, cost and scope of the project. Gantt chart is an effective tool to get an idea on elements like time management, finances and tasks which are to be completed.
A simple Gantt Chart can be understood and created in the following way:

Importance of a Gantt chart is understood in project planning where it gives a rough idea on the estimated time of implementation and compares it with the actual time taken for the task to be implemented. This helps in understanding and implementing similar projects in the future, which facilitates companies in making better strategies.
However, despite its usefulness, Gantt chart’s are more of a framework for giving a brief understanding about the project schedules and deadlines. Gantt Chart simply gives an approximate time in which each task would be completed. But it is feasible for only understanding small and less number of projects. A Gantt chart for a large number of projects could be misleading as proper understanding and evaluation of every task and project schedule correctly is not possible. Moreover, a Gantt chart only focuses on three main elements like time, scope and cost of the project. Of these, only time gives a realistic approximation but the other two cant vary drastically when a project is being completed. Also, it doesn’t take into account operational processes, batch production, employee management etc.
It is very critical for operations of a company to plan and prioritise every activity which needs to be performed. Whether it is regarding the project preparation or mid-way or project completion, companies and individuals must prepare a time frame and perform according to deadlines. And this scheduling of operations is effectively undertaken by preparing and evaluating using a Gantt chart.
The article has been authored by the editorial team. The content on MBA Skool has been created for educational & academic purpose only.
If you are interested in writing articles for us, Submit Here
Share this Page on:
What is MBA Skool?About Us
MBA Skool is a Knowledge Resource for Management Students, Aspirants & Professionals.
Business Courses
Quizzes & Skills
Quizzes test your expertise in business and Skill tests evaluate your management traits
All Business Sections
Write for Us